

Welcome to Weather-Above
please refresh
the page for the latest data
Cheddleton Lightning Detection
Cheddleton weather station in contributing data to "Blitzortung.org" this is a community of station operators who transmit their data to the central server, To see our live data please click on the following link

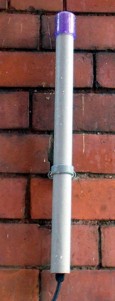


Ferrite rod antenna
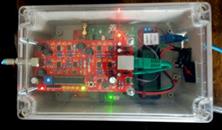
E-field Amplifier + Controller PCB
/ STM32F4 DISCOVERY +
AS3935 Franklin Lightning Sensor
Mounted in one Box
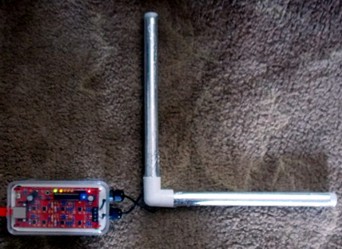
H-field Amplifier
Mounted in one Box
E-Field antenna
H-field Amplifier pcb
E-Pre Amplifier PCB
Controller PCB
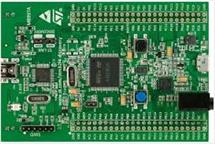
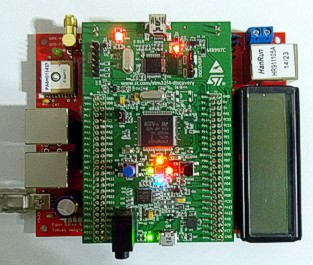
STM32F4 DISCOVERY
Controller PCB
Plugged in to
STM32F4 DISCOVERY
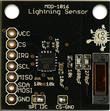
AS3935 pcb Lightning Sensor
Connected to the
STM32F4 DISCOVERY Board
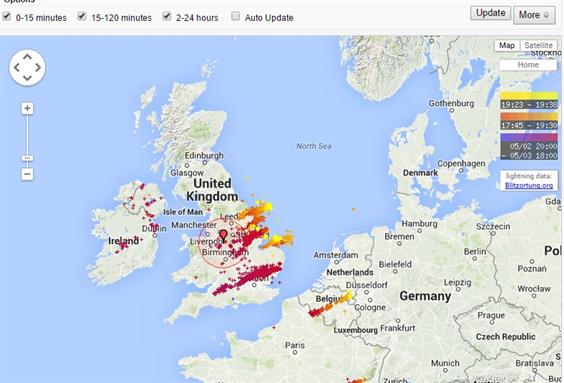
"Blitzortung.org" this is a community of station operators who transmit their data to the central server ,Lightning Detected on the network 03/05/15
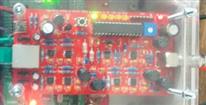
E-field Amplifier